

EUR/USD flipped to positive territory on the daily chart Wednesday, recovering from a European session low of 1.1720 to trade just above 1.1750 ahead of the US open. The US Dollar’s recovery attempt has stalled, though the upcoming release of US Jobless Claims could inject some volatility into an otherwise sluggish year-end trading session.
Broader Context: A Strong Year for the Euro From a wider perspective, the Euro remains on track to secure a 14% annual gain. This rally has been driven largely by the monetary policy divergence between the European Central Bank (ECB) and the Federal Reserve. Additionally, the softening US economy and uncertainty surrounding President Donald Trump’s trade policies have weighed heavily on the Greenback.
Fed Minutes Highlight Divergence The Euro’s pullback accelerated briefly on Tuesday after the FOMC minutes raised doubts about the timing of the next interest rate cut. However, the US Dollar is still set to record its worst yearly performance in eight years, with the Dollar Index (DXY) down nearly 10% over the last 12 months.
The minutes from the December 9-10 meeting confirmed that the 25 basis point rate cut was approved by a 9-3 vote—the highest level of dissent in six years. This split highlights the Fed’s challenge in supporting a deteriorating labor market without fueling inflation. Most members agreed that further cuts would be conditional on inflation declining in line with projections, signaling potentially just one cut in 2026 and another in 2027.
Market Focus: Jobless Claims Investor attention now turns to the weekly US Jobless Claims report, which is expected to show initial filings rising to 220K from 214K the previous week. Despite this data, trading volumes are expected to remain thin, with Japanese markets closed for the week and most global markets shutting down on Thursday for New Year festivities.
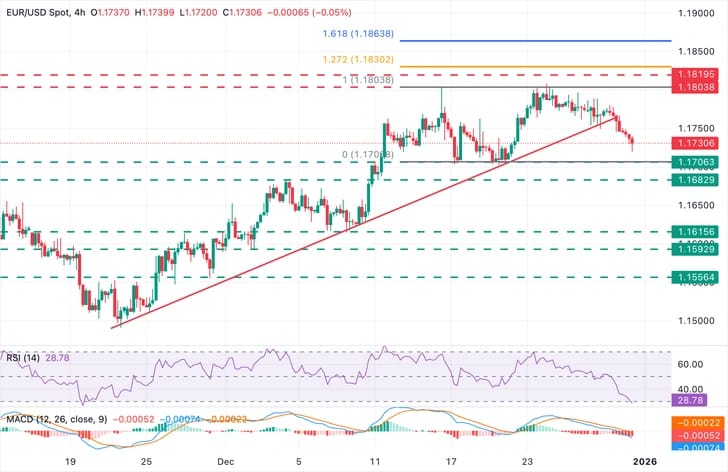
EUR/USD is staging a modest recovery at the time of writing, though technical indicators remain tilted to the downside. The 4-hour Relative Strength Index (RSI) has rebounded from near-oversold territory but continues to trade below the 50 neutral mark. Similarly, the Moving Average Convergence Divergence (MACD) indicates that while bearish momentum is easing, the indicator remains below the zero line.
Resistance Levels On the upside, the reverse trendline near 1.1770 serves as immediate resistance. A breakout above this level would clear the path toward the 1.1805 area (highs from Dec 16 and 24), followed by the September 23-24 peaks near 1.1820.
Support Levels Conversely, any bearish reversal is likely to encounter initial support at the psychological level of 1.1700 (lows from Dec 17 and 19). A breach of this level exposes the next target at 1.1680 (Dec 4 high/Dec 11 low), with further downside risk towards the 1.1615