

On-chain data send mixed signals as protocol fees decline even while trading volume tops $3 trillion. Since launch, Aster has now recorded $3.10 trillion in cumulative trading volume—narrowing the gap with Hyperliquid’s $3.20 trillion—and currently holds a TVL of $1.16 billion.
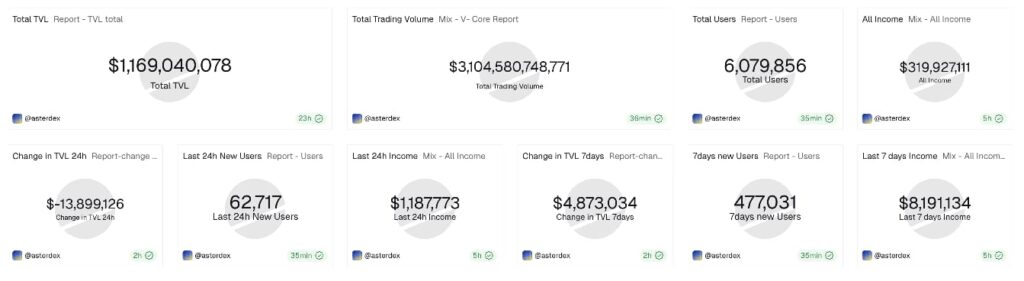
Aster’s DEX data on Dune indicate that user growth has stalled, reflected in a drop in protocol fees. According to DeFiLlama, those fees have remained under $20 million since mid-October, totaling just $15.83 million in the past week.
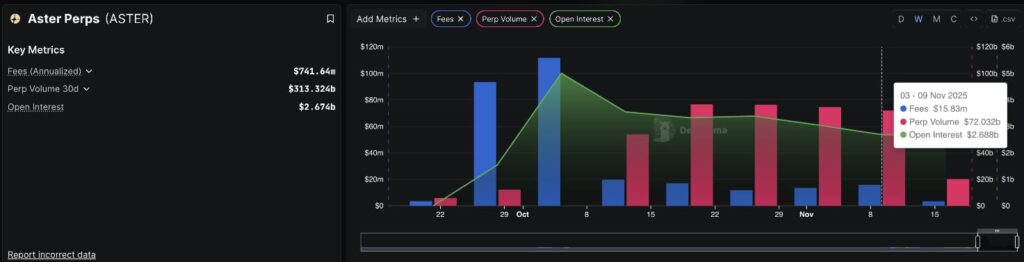
Aster Perpetuals Data (Source: DeFiLlama)
Open interest on Aster’s perpetual contracts has fallen to about $2.67 billion, down sharply from $5.01 billion on October 5. This pullback in OI points to a more risk-averse mood among traders— mirroring the drop in protocol fees on the Binance-backed DEX.
Perpetuals trading volume has also weakened. Last week’s volume came in at $72.02 billion, versus $76.66 billion in mid-October, and so far this week it sits at $20.56 billion, with little sign of a rebound.
Technical Outlook: Eyeing a Breakout Rally
Aster has powered past the $1.1742 resistance level and is now testing the 200-period EMA on the 4-hour chart at $1.2106. Bulls will need a decisive close above $1.2106 to confirm a breakout from the ascending triangle pattern that’s been forming since November 5.
If that level holds, the next upside targets are the $1.2977 low from October 14 and then the $1.5990 high from October 13.
Supporting this bullish case, the 4-hour RSI has climbed to 63—up from neutral territory—with room to run before hitting overbought. Meanwhile, the MACD has crossed above its signal line, with rising green histogram bars signaling a fresh surge in buying momentum.
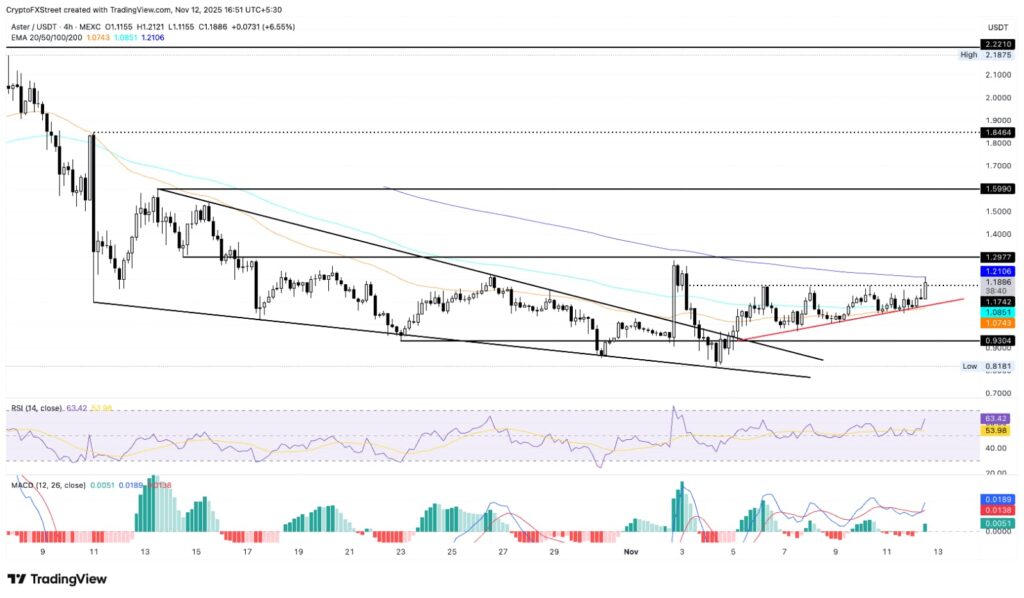
ASTER/USDT 4-Hour Chart
Despite the recent uptick, weakening user adoption could spark a bearish reversal. A decisive break below the 50-day EMA at $1.0743 would likely trap bullish traders, invalidate the ascending-triangle breakout, and open the door to further losses toward the October 23 low of $0.9304.