

At press time on Wednesday, Pi Network (PI) is trading near $0.2100, finding stability following a 1% rebound from a critical support trendline the previous day. This recovery coincides with improved sentiment throughout the broader cryptocurrency market, as Bitcoin (BTC) has climbed back above the $95,000 level. However, the technical outlook for PI remains uncertain; despite the recovery, the asset is approaching key resistance without significant momentum.
Pi Network rose 1.55% on Tuesday, recuperating from a 1% decline at the start of the week. This bounce aligned with a wider market recovery fueled by two key factors: softer-than-anticipated US core Consumer Price Index (CPI) data and news of a US Senate draft bill proposing a new structure for crypto markets.
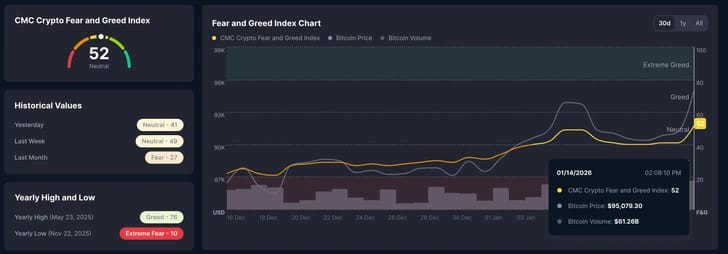
This shift toward bullish sentiment is evident in the crypto Fear and Greed Index, which has risen to a neutral reading of 52, up significantly from the fear-dominated score of 31 seen on January 1. Generally, index values below 40 indicate fear, values between 40 and 60 suggest neutral sentiment, and values above 60 reflect greed.
While price movement has been muted following the January 9 announcement of the Pi Library (offering Pi Payments integration), a sentiment-driven recovery could still fuel a sustained short-term rebound.
Momentum indicators suggest a lack of conviction in PI At the time of writing, PI has stabilized near $0.2100 following a bounce off a local support trendline that connects the lows of December 17 and 30.
On the daily logarithmic chart, momentum remains unclear. The Relative Strength Index (RSI) is flattening near the neutral 50 mark. Meanwhile, the Moving Average Convergence Divergence (MACD) hovers above its signal line, avoiding a bearish crossover; however, declining histogram bars indicate that bullish momentum is weakening.
Should PI successfully clear immediate resistance levels—specifically the 50-day Exponential Moving Average (EMA) at $0.2149 and the December 19 high at $0.2177—the rally could potentially extend toward the September 23 low of $0.2613.
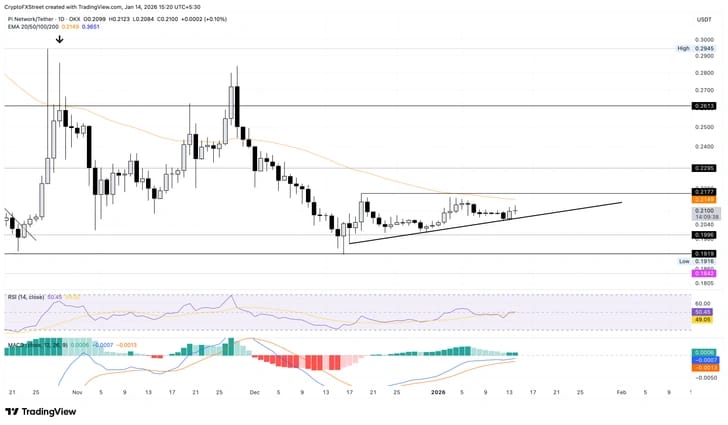
Conversely, a drop below $0.2000 could lead to a test of the October 11 low at $0.1919 on the daily logarithmic chart