
Shiba Inu (SHIB) is holding firm at about $0.0000092 as of Tuesday, following a 3% rebound that found support at this crucial level. Bullish sentiment is being driven by rising trading volumes, significant whale activity, buy-side dominance and positive funding rates. Technically, SHIB appears set for another push higher, with targets above $0.000010 in focus.
Nine-Month High in Trading Volume
Santiment data show that the total exchange volume across the SHIB ecosystem climbed to $66.91 trillion on Sunday and settled at $4.01 trillion on Tuesday—the strongest reading since March 2024. This surge in volume points to growing trader interest and deeper liquidity in SHIB, underpinning its optimistic outlook.
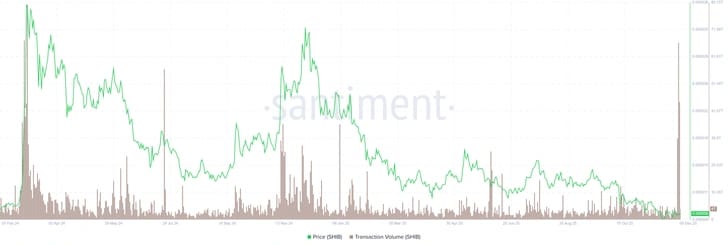
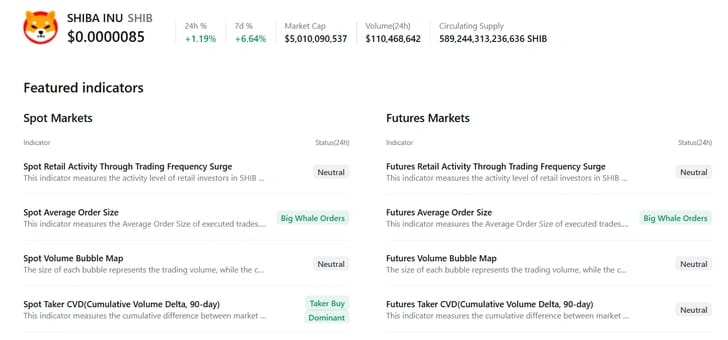
Santiment’s trading‐volume chart highlights SHIB’s recent surge in activity. Meanwhile, summary data from CryptoQuant reinforce a bullish outlook, with both spot and futures markets showing sizable whale orders and clear buy‐side dominance—signals that point to a potential rally ahead.
On the derivatives front, SHIB’s funding‐rate data are also pointing toward a recovery. Coinglass’s open‐interest–weighted funding rate shows more traders betting on a price increase than a decline. The metric flipped positive on Monday and reached 0.0096% on Tuesday, meaning longs are now paying shorts. Historically, as the chart below illustrates, these shifts from negative to positive funding rates have coincided with sharp rallies in Shiba Inu’s price.
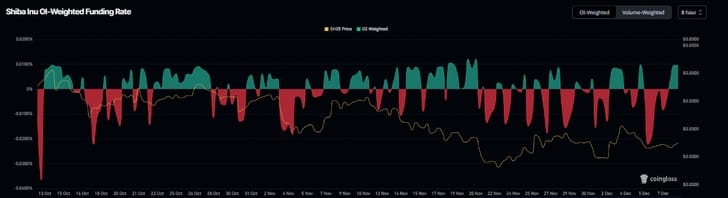
Shiba Inu’s funding rate chart. Source: Coinglass
Shiba Inu Price Forecast: SHIB Holds at Key Support
On December 3, SHIB cleared the falling-wedge pattern (defined by two converging trendlines), only to be turned away at the 50-day Exponential Moving Average (EMA) near $0.0000092. Since then, it has bounced off the wedge’s upper trendline and climbed almost 3% on Monday. As of Tuesday, SHIB is once again testing support around $0.0000092.
If this rebound continues, the next major hurdle lies at $0.000010. The daily Relative Strength Index (RSI) sits at 46 and is trending upward toward the neutral 50 mark—signaling that bearish pressure is easing. For the bulls to stay in control, the RSI will need to clear above 50. Meanwhile, last week’s bullish MACD crossover remains intact, further reinforcing the case for an upside move.
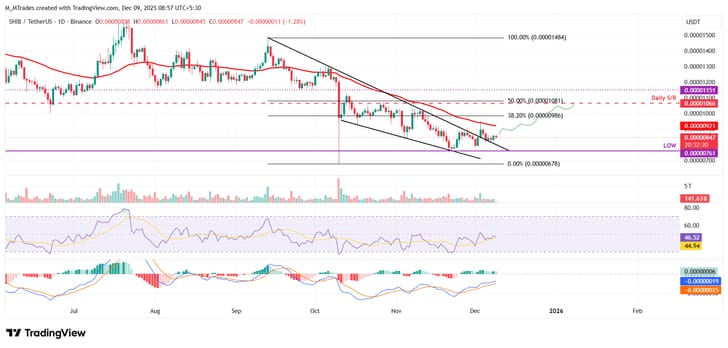
SHIB/USDT Daily Chart
If SHIB undergoes a pullback, the decline could extend toward its next major support around $0.0000076.