

Chainlink (LINK) has slipped into weakness, trading near $13.84 as of Friday’s session. This marks the second straight day of mounting selling pressure. If buyers can’t reclaim key resistance levels and turn them into support, LINK could tumble about 16% toward $12.76.
Moderate ETF inflows follow Chainlink spot ETF debut
Grayscale’s Chainlink spot ETF (ticker: GNLK) launched in the U.S. on Tuesday and attracted $37 million in inflows on day one, followed by $3.84 million on Wednesday. According to SoSoValue, the ETF extended its positive run with another $4.46 million inflow on Thursday. Cumulative inflows now total roughly $45 million, with assets under management at about $72 million. Over time, sustained ETF inflows may bolster sentiment and help support LINK’s price.
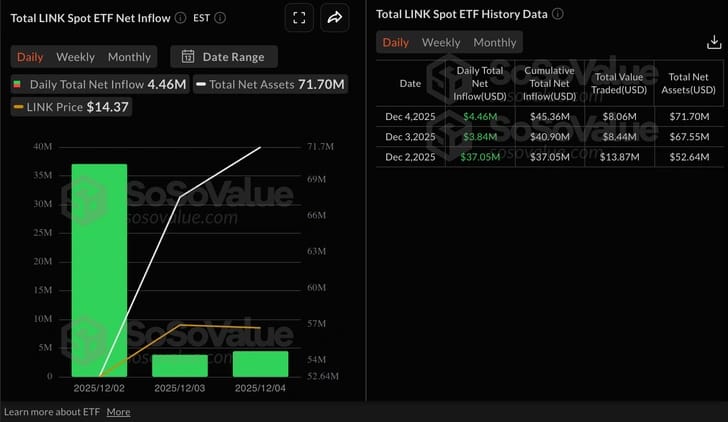
LINK ETF stats | Source: SoSoValue
On the derivatives side, Chainlink’s futures open interest (OI) has weakened, falling to $598 million on Friday from $658 million the day before. Retail engagement has remained muted since the October 10 flash crash—which wiped out more than $19 billion in crypto derivative positions in a single session. For perspective, OI peaked at nearly $2 billion on August 24 and averaged around $1.36 billion on October 10.
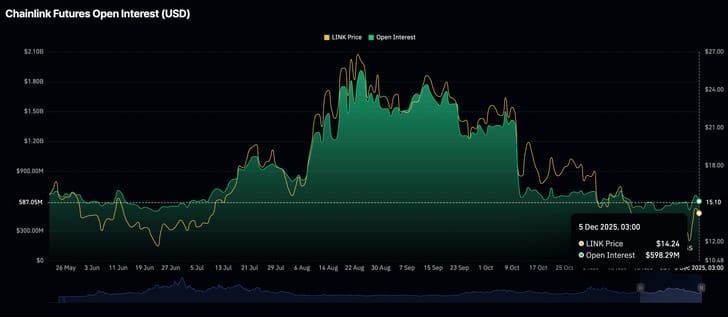
Chainlink Open Interest | Source: CoinGlass
Technical Outlook: LINK Faces Rising Downside Risks
As of Friday, Chainlink (LINK) is trading around $13.82, held back by its declining moving averages—50-day EMA at $15.23, 100-day EMA at $16.85, and 200-day EMA at $17.45—reinforcing a bearish bias. On the daily chart, the MACD line sits above the signal line, but the shrinking positive histogram bars suggest that bullish momentum is fading.
Meanwhile, the RSI has eased to a neutral 49 from recent highs, and a falling trend line drawn from $27.87 remains in place as a ceiling, with immediate resistance near $18.35.
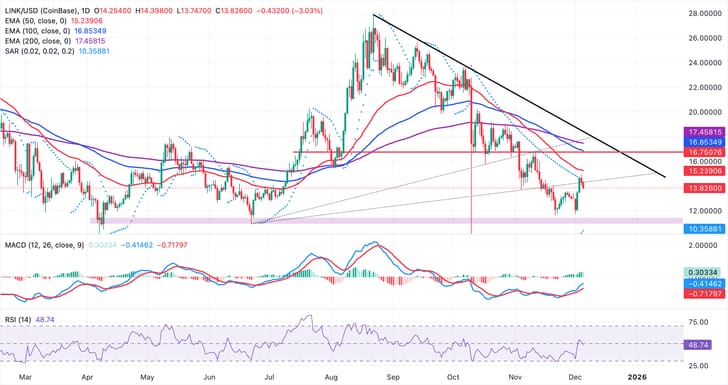
On the daily chart, the Parabolic SAR has flipped below the price, with its latest dot at $10.35—suggesting tentative stabilization. An ascending trend line from $10.93 underpins the market, offering support around $14.30. A daily close above the 50-day EMA would clear the way toward the 100-day EMA, while a failure to hold this level could expose LINK to fresh downside pressure. Bullish momentum would intensify if the MACD histogram expands again and the RSI pushes back above 50.