


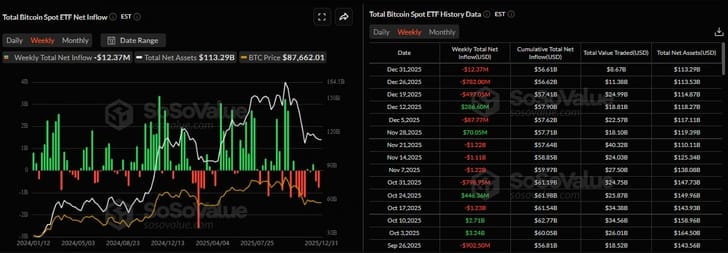
Bitcoin (BTC) is hovering around the $89,000 mark this Friday, extending a three-week trend of sideways movement as the market grapples with indecision. Institutional appetite appears to be waning, evidenced by spot Bitcoin ETFs recording mild net outflows for the third week in a row. While thinner year-end liquidity has helped stabilize broader risk sentiment, it has also kept BTC locked within a tight trading range.
Data from SoSoValue highlights this softening demand, showing a total net outflow of $12.37 million as of Thursday—marking the third consecutive weekly decline since mid-December. If this trend of outflows accelerates, Bitcoin could face a potential price correction.
Emerging Optimism from Macro Liquidity Recent data suggests underlying market support. Reuters highlighted that the NY Fed’s Standing Repo Facility (SRF) issued a record $74.6 billion in loans on the last trading day of 2025, beating the previous record. Simultaneously, $106 billion flowed into the reverse repo facility—the highest since August. This surge is largely attributed to year-end positioning, where lenders retreat to the safety of the Fed. While this tightens lendable funds initially, the subsequent direct borrowing from the central bank helps stabilize short-term funding and supports a mild “risk-on” environment.
Furthermore, the Federal Reserve’s ongoing purchase of $40 billion in Treasury bills per month (started Dec 12) is injecting net liquidity into the system. This cheaper borrowing cost tends to favor risk assets like equities and cryptocurrencies, offering near-term support for Bitcoin.
Technical Outlook: Consolidation Continues Bitcoin remains directionless, fluctuating between $85,500 and $90,000 for three weeks, with the price currently sitting near $89,000.
- Bullish Scenario: A daily close above the $90,000 resistance could trigger a rally toward $94,253. This target aligns with the 61.8% Fibonacci retracement level (measured from the April low of $74,508 to the October all-time high of $126,199).
- Indicators: The Daily RSI is at 51, just above neutral, suggesting bearish pressure is fading. Additionally, the MACD retains its bullish crossover from December 20, keeping the door open for upward momentum.
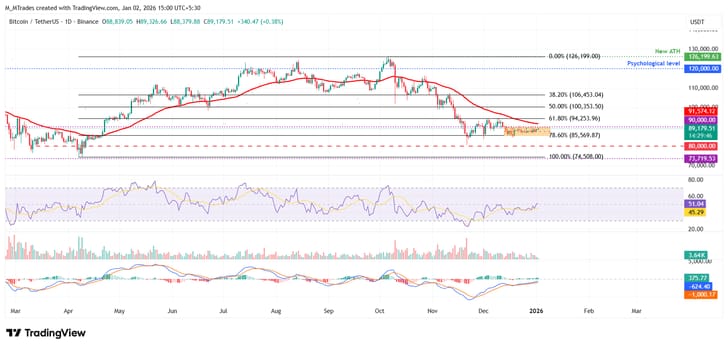
Conversely, if a correction occurs, Bitcoin could slide back toward the lower end of its consolidation range near $85,500.