

Bitcoin (BTC), Ethereum (ETH) and Ripple (XRP) are trading under pressure as the broader crypto market enters a midweek correction. The tepid price action among these top three by market cap suggests room for a deeper pullback, with momentum indicators increasingly favoring the bears.
Bitcoin in particular risks extending its slide if it fails to close above $85,569 on the daily chart. BTC was turned away from a descending trendline—drawn across multiple October highs—on Friday, sparking a nearly 7% drop that retested the $85,569 support level on Monday. It managed a small rebound there on Tuesday and was hovering near $87,300 at the time of writing on Wednesday.
That said, a decisive close below $85,569—which also corresponds to the 78.6% Fibonacci retracement—would likely open the door to a move toward the $80,000 psychological mark. Technicals underscore the bearish case: the daily RSI sits at 40 (below the 50 neutral threshold), signaling growing downside momentum, while the MACD lines are converging and look poised for a bearish crossover.
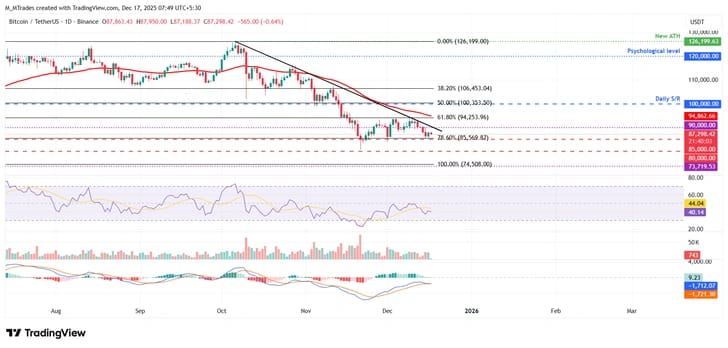
On the BTC/USDT daily chart, a sustained bounce could propel Bitcoin up toward the 61.8% Fibonacci retracement level near $94,253.
Ethereum’s technicals, however, remain weighted to the downside. ETH failed to break and close above its 50-day EMA at $3,249 on December 10, triggering an 11% slide into Tuesday. As of Wednesday, it’s still trading under $2,946. If the current correction continues, Ethereum could test its next support zone around $2,749. The daily RSI sits at 41—below the neutral 50 mark—signaling growing bearish momentum, and Wednesday’s MACD bearish crossover reinforces the negative outlook.
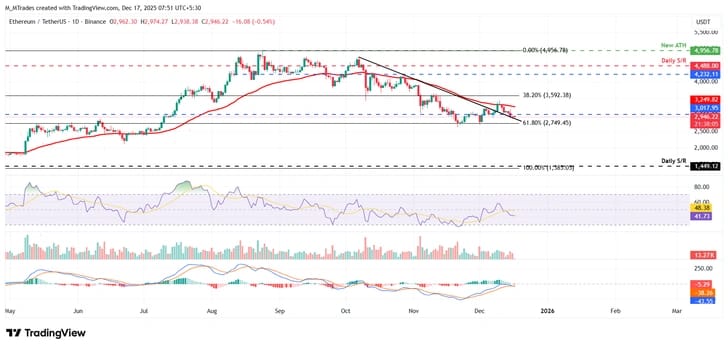
On the ETH/USDT daily chart, a successful rebound could send Ethereum up toward its 50-day EMA near $3,249.
Meanwhile, bears in XRP are targeting $1.77 after the price slipped below a key support level. Ripple’s token dropped for a second straight week, sliding 3.22% and retesting the $1.96 floor on Sunday. That bearish momentum carried into Monday’s close beneath $1.96, though XRP managed a slight bounce on Tuesday and was trading around $1.91 by Wednesday. If selling continues, the next area of interest is the $1.77 support zone. Technical indicators reinforce this bearish outlook: the daily RSI sits at 37 (below the neutral 50 line), and the MACD crossed lower on Sunday and remains in a bearish configuration.
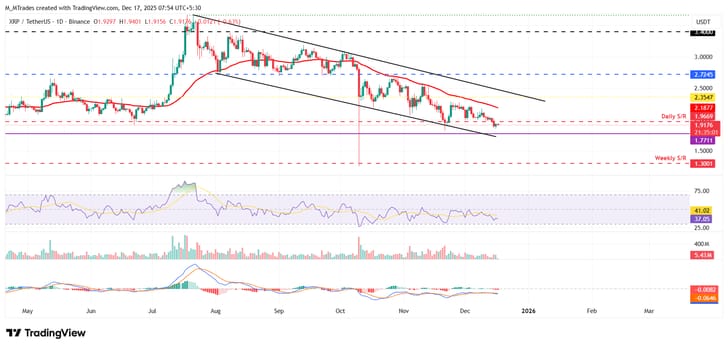
On the flip side, a rebound in XRP could drive prices back up toward the daily resistance near $1.96.