

Arbitrum (ARB) is currently trading lower at $0.22 as of Wednesday, reflecting a general downturn in the cryptocurrency market. The token has struggled to recover since its Q3 peak of $0.62 in August, indicating persistent bearish sentiment.
Despite the price performance, Arbitrum’s ecosystem continues to achieve significant development milestones, as highlighted in a recent Messari report. These advancements are positioning Arbitrum as a developer-friendly platform with adaptable, enterprise-grade infrastructure.
Arbitrum Everywhere: Expanding Beyond Ethereum Layer-2 Scaling
Arbitrum’s strategic focus has shifted from solely scaling Ethereum with Layer-2 rollups to building a comprehensive, developer-centric, scalable, and diverse infrastructure suitable for enterprise applications.
The ‘Arbitrum Everywhere’ framework supports the entire application lifecycle. Developers can initiate projects on Arbitrum One, leveraging its shared liquidity layer for seamless scaling and ecosystem benefits. As applications mature, they can transition to a customizable Arbitrum Chain built with Arbitrum Nitro technology. The combination of Arbitrum One and Arbitrum Orbit forms the foundation of Arbitrum Everywhere, solidifying its position as a leading infrastructure layer for future applications.
This framework is supported by four core pillars:
- Builder Freedom: Ensures technology adapts to developers throughout their application’s lifecycle.
- Enterprise-Ready: Validates the infrastructure through the launch of institutional-grade applications.
- DeFi Unchained: Fosters composable liquidity and an active user base, enhancing Arbitrum’s leadership in the Decentralized Finance (DeFi) sector.
- Digital Sovereign Nation: An economic engine managed by the Arbitrum DAO, designed to drive value for stakeholders through a growth flywheel.
Technical Outlook: Can Arbitrum Hold Key Support?
Arbitrum is currently holding above $0.22 amidst high market volatility. Technically, ARB is trading below key moving averages – the 50-day EMA ($0.31), 100-day EMA ($0.35), and 200-day EMA ($0.40) – all of which reinforce the bearish outlook and act as resistance levels.
The daily Moving Average Convergence Divergence (MACD) indicator has displayed a sell signal since Friday, suggesting investors might consider reducing their risk exposure. If the blue MACD line remains below the red signal line, selling pressure is likely to continue. A break below the immediate $0.22 support could see Arbitrum extending its downtrend below $0.20.
Here’s an image that captures the essence of “Arbitrum Everywhere” with its various pillars and focus on developers and enterprise solutions.
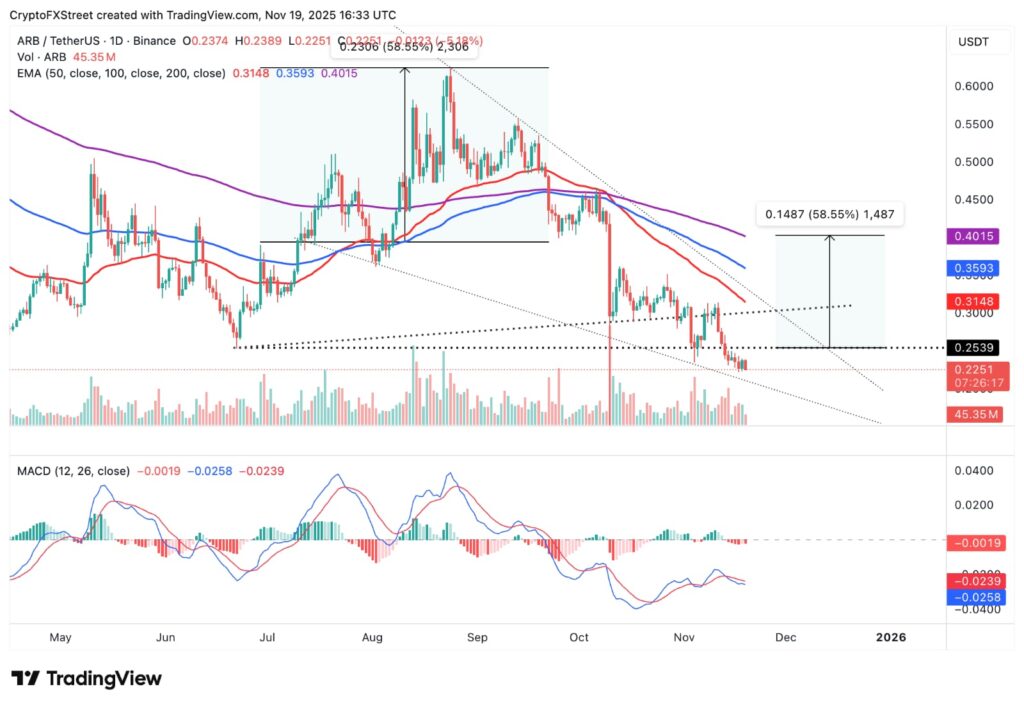
ARB/USDT Daily Chart Analysis
Should investors engage in “buy the dip” strategies, ARB could potentially reverse its current trend and aim for a short-term resistance level at $0.25. Furthermore, a falling wedge pattern observed on the daily chart suggests a significant 58% upside target, potentially reaching $0.40, if ARB successfully breaks above the pattern’s upper trendline.
Here’s an illustrative image depicting an ARB/USDT daily chart with a falling wedge pattern and potential price targets.