
While the broader cryptocurrency market is experiencing declines, Aster (ASTER), Starknet (STRK), and Zcash (ZEC) have seen gains over the past 24 hours, though they are struggling to maintain these advances. The technical outlook for Aster and Zcash appears mixed, with potential for bearish turns, while Starknet might extend its rally after breaking out of a consolidation range.
Aster Struggles at Key Resistance
Aster has fallen approximately 3% at the time of writing on Monday, following a 14% surge the previous day. This Decentralized Exchange (DEX), which focuses on perpetuals and is backed by Binance, faces the risk of a more significant correction as it retreats from the $1.29 resistance level, a point last seen at the October 14th low.
Immediate support for ASTER is found at the 200-period Exponential Moving Average (EMA) on the 4-hour chart, currently at $1.19. Below that, the 50-period EMA at $1.12 offers further support. Should these key moving averages fail to halt the pullback, the psychological level of $1.00 could be threatened.
The Relative Strength Index (RSI), currently at 65, is moving downwards from the overbought territory, indicating diminishing buying pressure amidst the intraday decline. A fall in the RSI below the midline could signal renewed selling interest.
Despite this, the Moving Average Convergence Divergence (MACD) continues to show a steady ascent, with the signal line indicating strong bullish momentum. However, if the blue MACD line crosses below the red signal line, it would signify the start of a new bearish momentum cycle, triggering a sell signal.
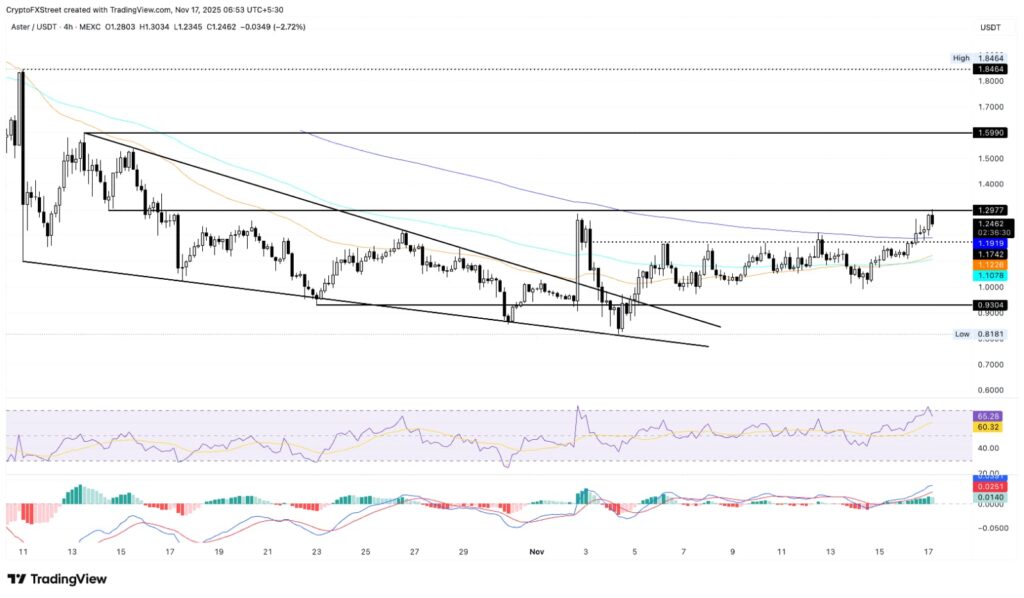
ASTER/USDT 4-hour price chart.
Should ASTER decisively break above the $1.29 level, its uptrend could extend towards the October 13th high of $1.59.
Starknet Extends its Rally
Starknet is showing a 7% gain at the time of writing on Monday, marking its fifth consecutive bullish candle. This breakout from consolidation, previously anticipated by FXStreet, is targeting the R2 Pivot Point at $0.2777.
On the daily chart, momentum indicators remain bullish, with the Relative Strength Index (RSI) at 74 moving into the overbought zone. Concurrently, the Moving Average Convergence Divergence (MACD) and its signal line continue their upward trajectory, supported by progressively rising green histogram bars, which signify strong bullish momentum.
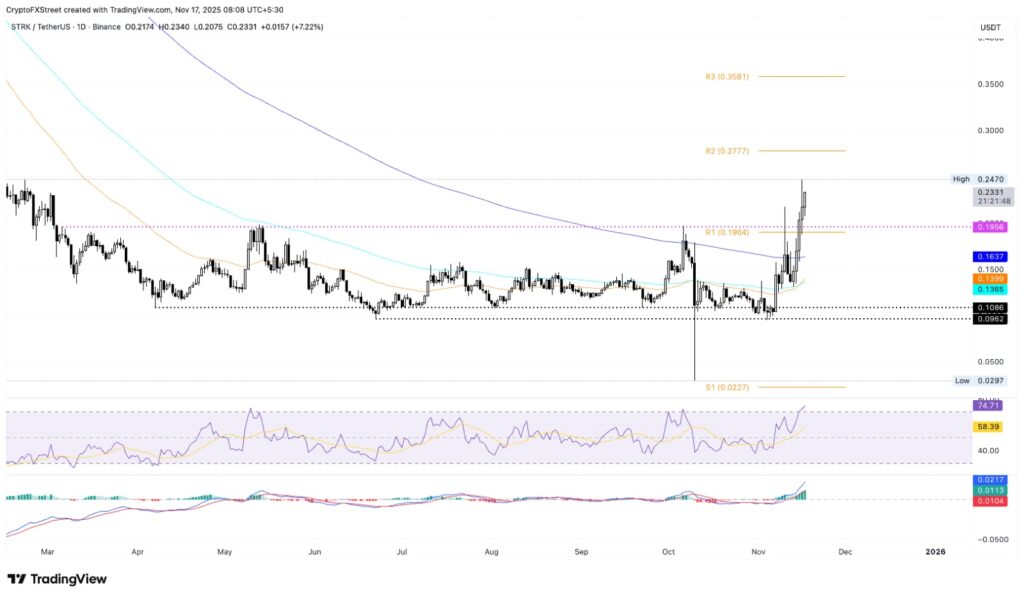
STRK/USDT daily price chart.
Conversely, the R1 Pivot Point at $0.1904 continues to be a critical support level for Starknet.
Zcash Recovery at Risk
Zcash is trading above $700 at the time of writing on Monday, maintaining an uptrend for five consecutive days. This reflects a rebound within a broader rising channel pattern. However, the struggle to break above the $750 high from November 7th suggests the potential formation of a double-top pattern, which could lead to a bearish reversal.
Should a reversal occur, the privacy coin might test the local support trendline at $512, followed by the November 12th low of $424.
Adding to the downside risk, the Relative Strength Index (RSI) shows a steady decline even as Zcash recovers, flashing a bearish divergence. Meanwhile, the Moving Average Convergence Divergence (MACD) and its signal line are in an uptrend, recovering from a sharp bearish collapse observed last week.
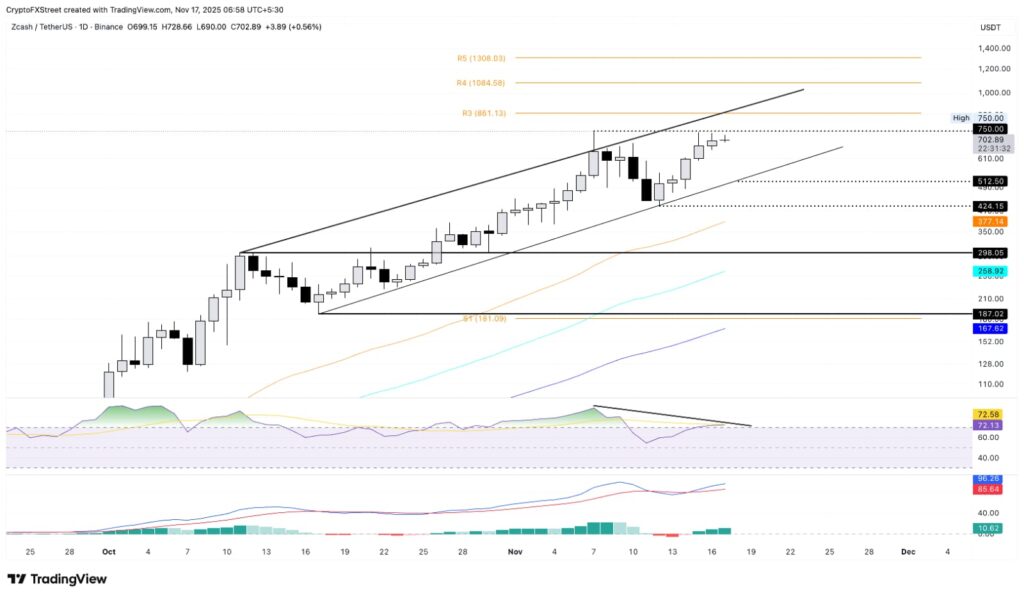
ZEC/USDT daily price chart.
Conversely, if an upside breakout from the $750 level occurs, the R2 Pivot Point at $861 could become the next target.