


Solana (SOL) is currently experiencing its third straight week of losses, having already dropped over 13% this week alone.
The recent performance of the two-week-old US Solana spot Exchange Traded Funds (ETFs) suggests a softening of institutional demand, as they have recorded their lowest net inflows to date. Additionally, sentiment in the derivatives market is suffering amid a broader market correction, leading to reduced risk exposure for Solana.
The technical outlook for Solana remains negative, with bears targeting the June low of $125.
Demand for Solana Falters Amid Market Volatility
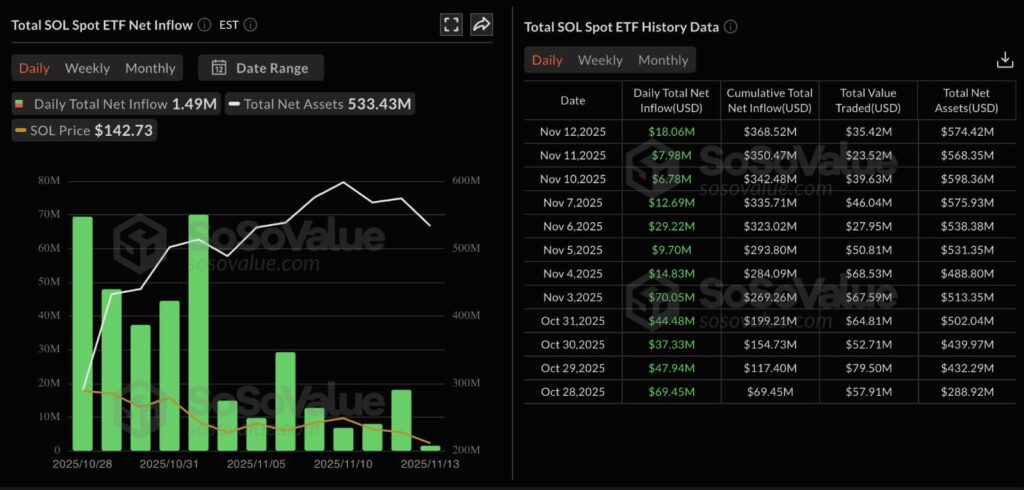
Solana is losing momentum and investor confidence as the broader cryptocurrency market struggles, particularly following Bitcoin’s (BTC) drop below $100,000. According to Sosovalue data, US Solana spot ETFs registered a net inflow of only $1.49 million on Thursday, primarily driven by the Bitwise Solana staking ETF. This figure represents the lowest inflow since the Solana ETFs were launched, reflecting diminished demand from institutional investors and prompting them to limit risk exposure as market conditions become unstable.
A similar bearish trend is evident in the derivatives market, with traders reducing the capital allocated to Solana futures as sentiment turns negative.
According to CoinGlass data, the Open Interest (OI) for SOL futures—which represents the notional value of all outstanding SOL futures contracts—has dropped by 3.34% in the last 24 hours to $7.35 billion. This reduction suggests that traders are either closing their existing long positions or actively reducing their leverage.
Further confirming this bearish shift, the OI-weighted funding rate has turned negative, hitting -0.0076% after being near-neutral earlier in the day. A negative funding rate indicates that traders are willing to pay a premium to hold short positions, signaling an expectation that the price correction will continue.
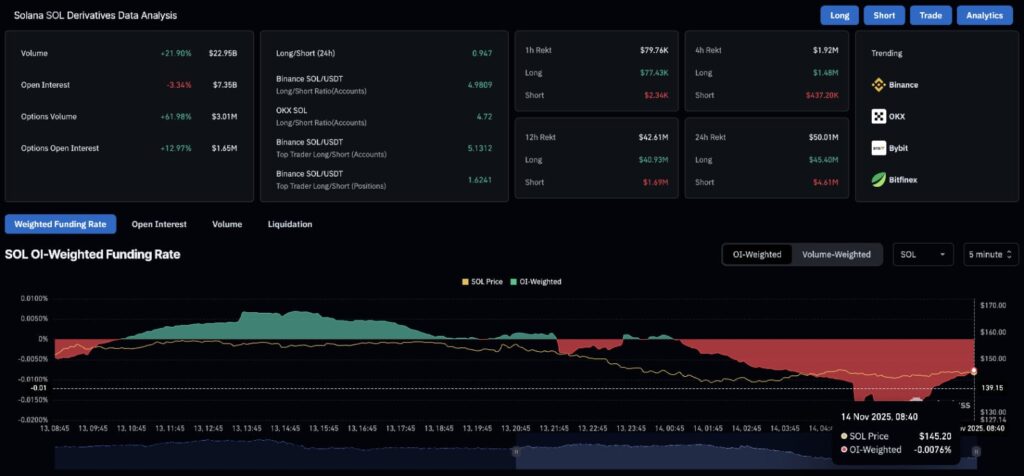
SOL Derivatives Data
If Solana derivatives continue to lose capital, or if the ETFs record their first day of net outflows, the path to recovery will be an uphill battle for the bulls.
Technical Outlook: Will Solana Extend the Decline to $100?
Solana is currently on its fourth consecutive day of decline this week, having broken below the significant $150 psychological level. As of the time of writing, SOL is down nearly 2% on Friday and is heading toward the $126 low recorded on June 22. Should SOL fall below $126, it could potentially test the major $100 psychological support level, followed by the $95 low from April 7.
The dominance of short-term bearish candles is driving down the 50-day Exponential Moving Average (EMA). This decline is causing it to converge with the 200-day EMA, raising the risk of a Death Cross pattern. If this pattern forms, it would flash a strong sell signal, confirming that the short-term bearish trend has overcome the longer-term trend.
Concurrently, the trend momentum is turning bearish on the daily timeframe, as the Moving Average Convergence Divergence (MACD) indicator has failed to cross above its signal line, thereby extending the downward movement.
At the same time, the Relative Strength Index (RSI) has dropped to 31 on the daily chart, moving toward the oversold zone and reflecting a fresh surge in selling pressure. However, because the RSI is hovering near the oversold boundary while the SOL price makes a fresh low, a bullish RSI divergence pattern is being generated, which often signals a potential bounce or reversal.
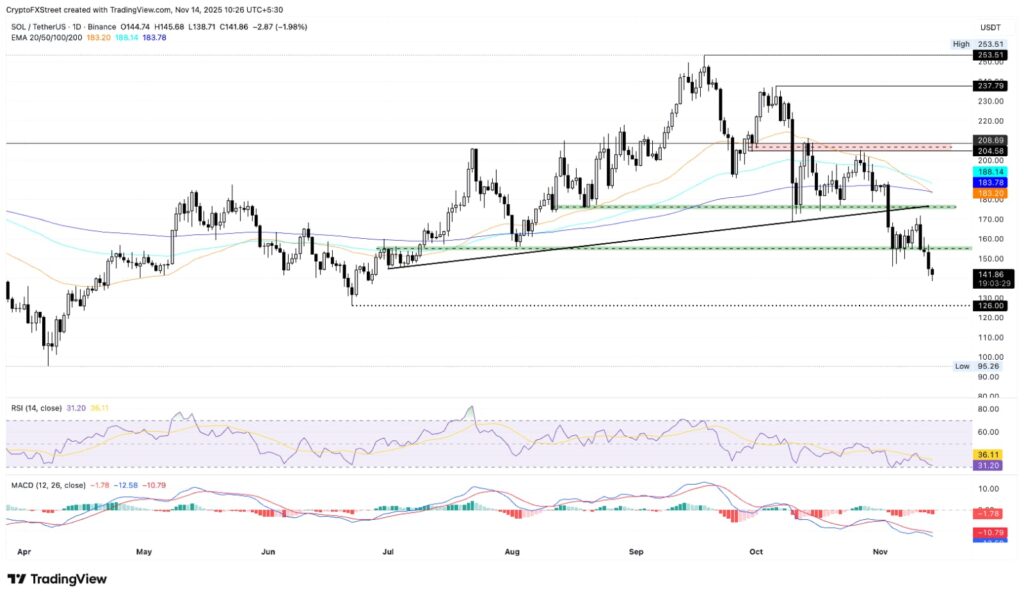
If SOL manages to climb back above the $155 area—which has recently flipped from a demand zone to a supply zone—it could target the $175 resistance level