


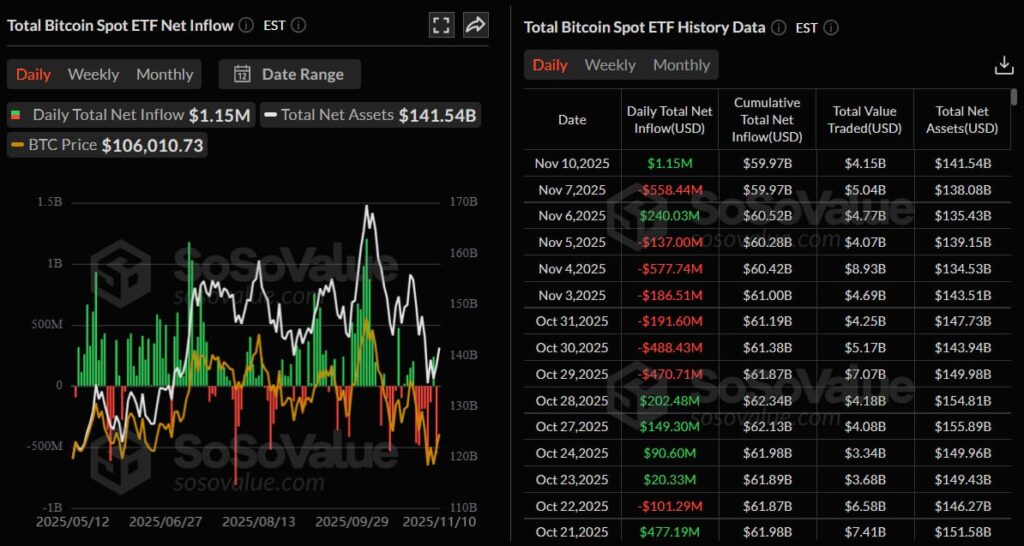
Bitcoin’s price eased slightly on Tuesday, holding around $105,000 after testing a major resistance level. A firm close above that barrier could clear the way for further gains in the world’s largest cryptocurrency. On the institutional side, US-listed spot Bitcoin ETFs saw an inflow of $1.15 million on Monday—a welcome reversal after $1.22 billion in outflows last week—which could help underpin BTC’s ongoing recovery.
Institutional Demand Sees Small Inflows
Data from SoSoValue shows that Monday’s $1.15 million injection into US-listed spot Bitcoin ETFs ended the prior week’s selling spree. If these ETF inflows continue to grow, they may provide the extra momentum needed to drive Bitcoin’s price higher.
Signs of renewed optimism
According to Glassnode’s Monday report, Bitcoin’s price appears to be stabilizing, with a possible local floor forming near the $100,000 mark. The recent rebound toward $106,000 points to buyers stepping back into the market. Spot trading volume jumped from $11.5 billion last week to $14.1 billion on Monday, highlighting stronger investor engagement and deeper liquidity. At the same time, the cumulative volume delta has ticked higher, suggesting sellers are showing less aggression, as illustrated in the chart below.
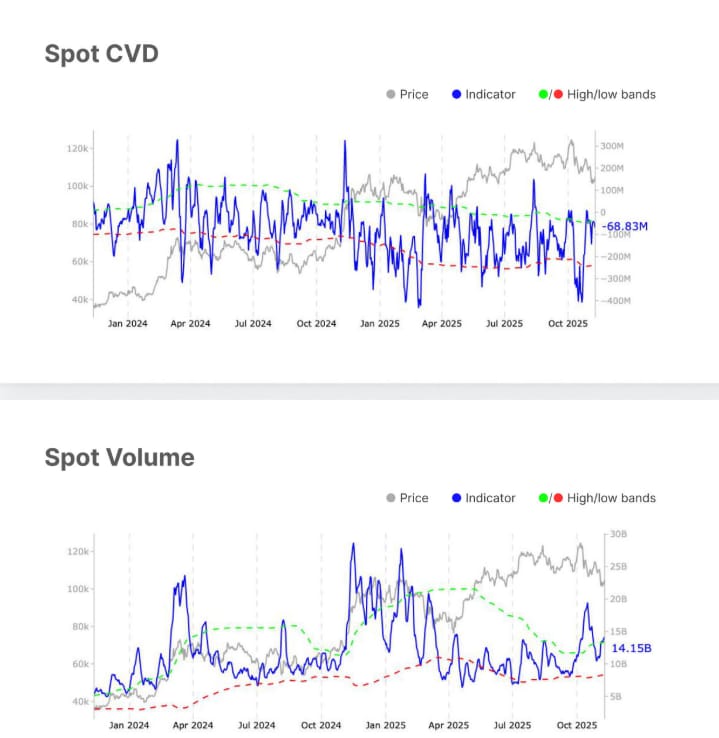
“Market conditions remain cautious but constructive,” a Glassnode analyst said. “Momentum is picking up, flows are stabilizing, and we’re seeing signs of a local bottom forming around $100,000. The $100,000–$108,000 zone could serve as a mid-term support base, although the broader macro downtrend in profitability continues to weigh on sentiment and cap upside conviction.”
Bitcoin Price Forecast: BTC Could Extend Recovery if It Closes Above $106,500
Bitcoin found firm support near the 50% Fibonacci retracement of its April–October move (from the $74,508 low on April 7 to the $126,299 high on October 6), which sits around $100,353. It held that level for four days after November 4. From Sunday to Monday, BTC rallied over 3% toward the next resistance at $106,453 (the 38.2% retracement) but ran into mild selling pressure, holding just above $105,000 at the time of writing.
A daily close above the 38.2% retracement near $106,500 could unlock further gains toward the 50-day Exponential Moving Average (EMA) at $110,041.
On the indicators, the Relative Strength Index (RSI) stands at 44 on the daily chart—approaching the neutral 50 mark and suggesting that bearish momentum is fading. For the recovery to sustain, the RSI needs to break above 50. Meanwhile, the MACD lines are drawing closer together, and the red histogram bars beneath zero are shrinking, pointing to an imminent bullish crossover.
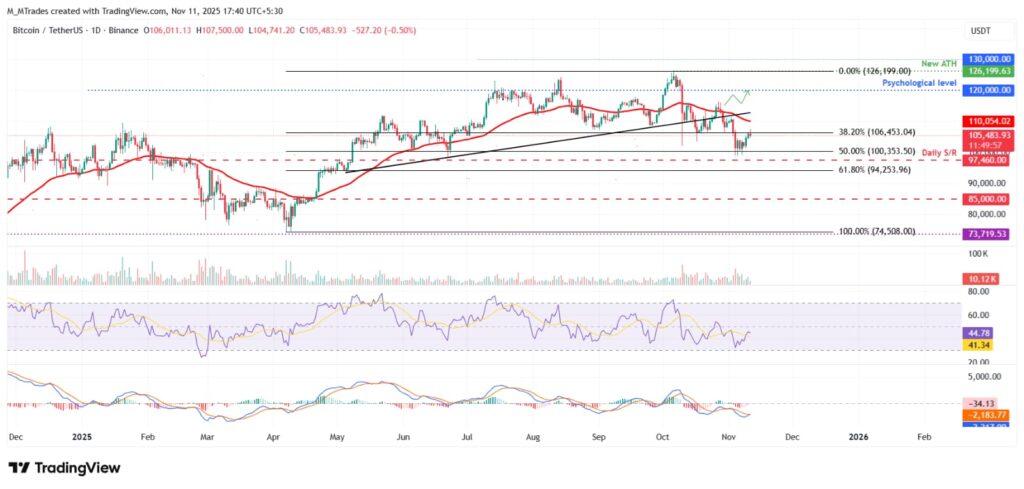
On the BTC/USDT daily chart, a pullback from the $106,453 level could see the price slide back toward the critical support around $100,353.